London · Finalist 2024
Reveal hidden stress patterns.
Get clear next steps.
Sample data only — not your health information. Simulate Treatment is a visual demo; no care is delivered. Not medical advice. Medical disclaimer.
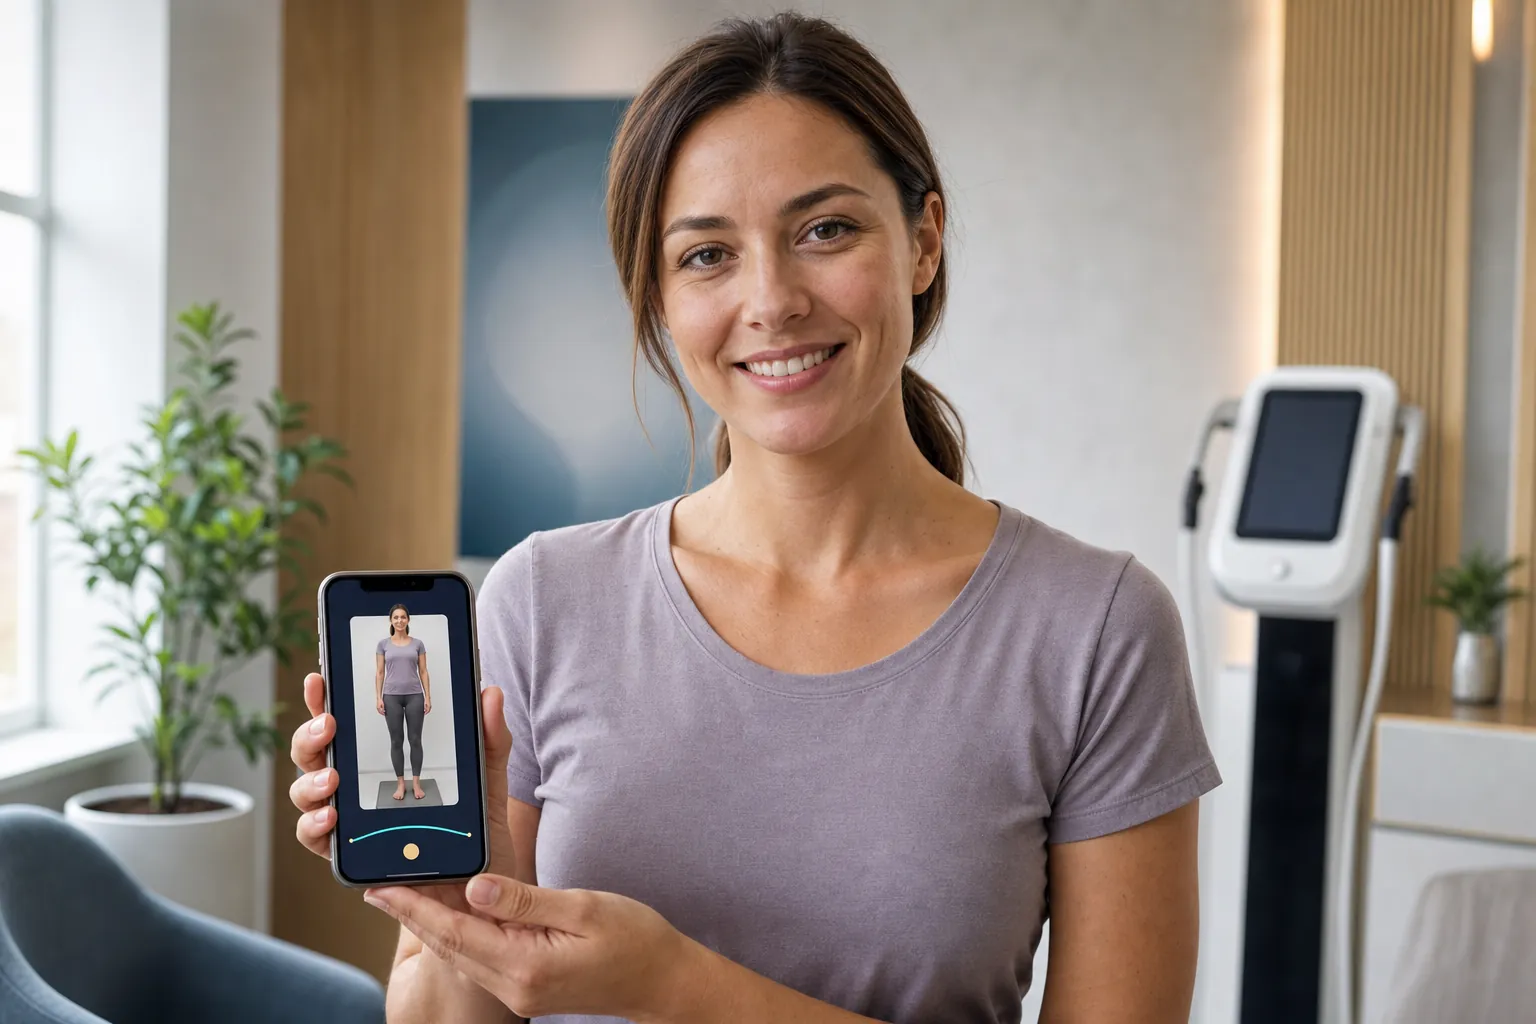
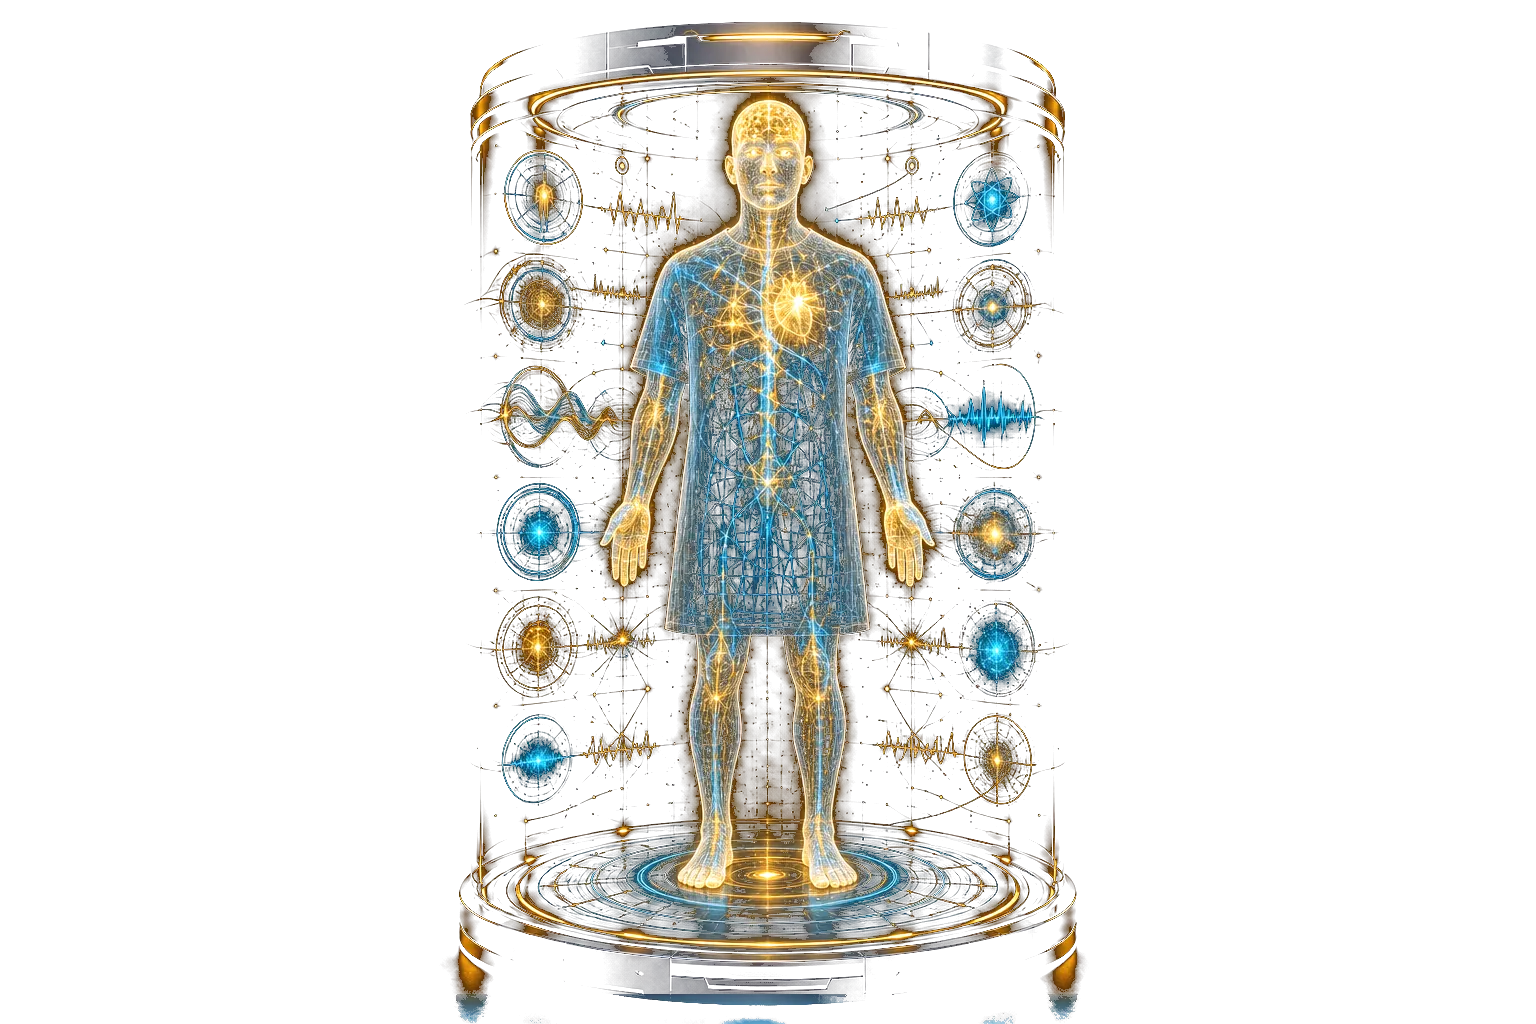
Live human previewAdvanced Global Health Diagnostics
Life Resonance Intelligence
Nonlinear Systems
Nonlinear Systems
Skin tone
DEMO ONLY
Loading 3D anatomy layers
Trusted recognition, technology lineage, and innovation ecosystem for long-term expansion
Top 100 Biotech Company
Innovation Recognition

Partner · Educator · Team
Measurement Lineage

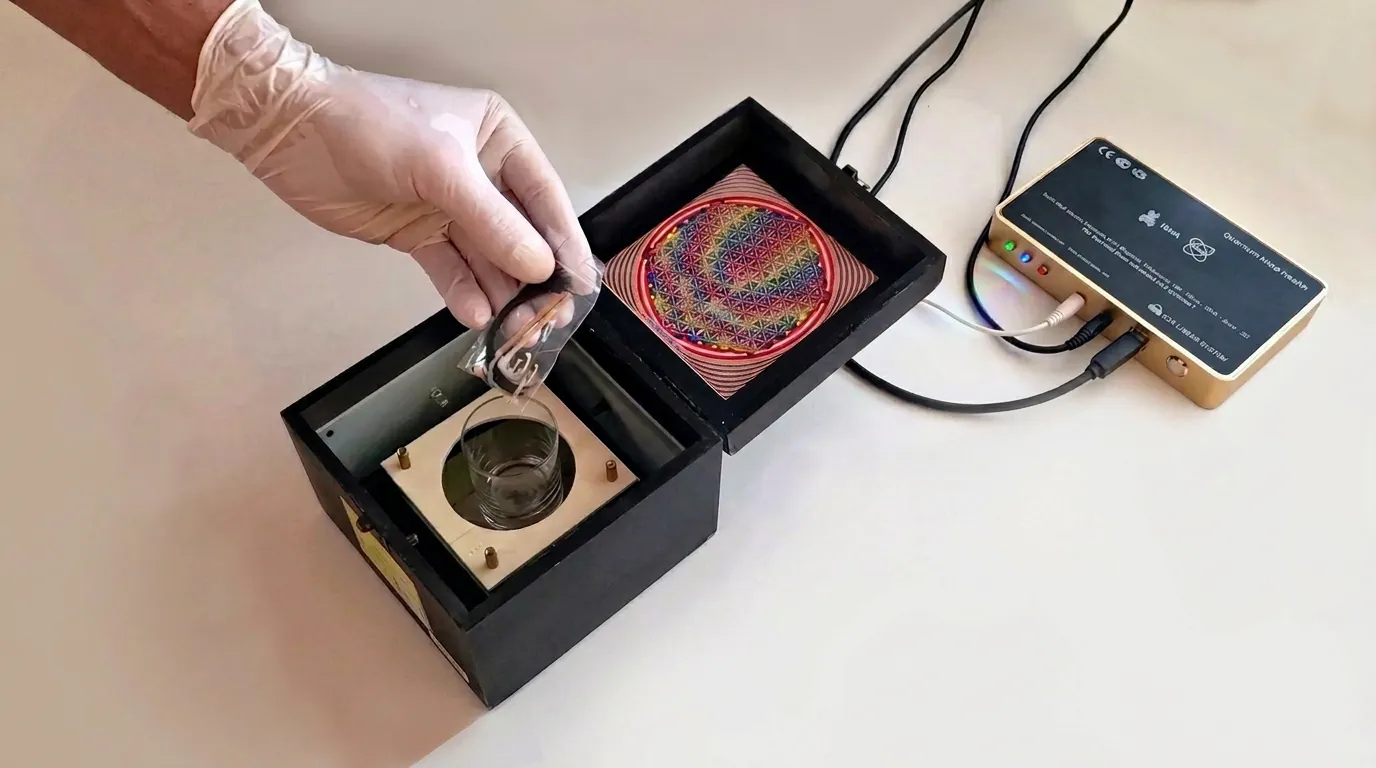
Legacy Instrumentation
Live Scan · Zero-Point · Torsion Technology
How the Platform Works
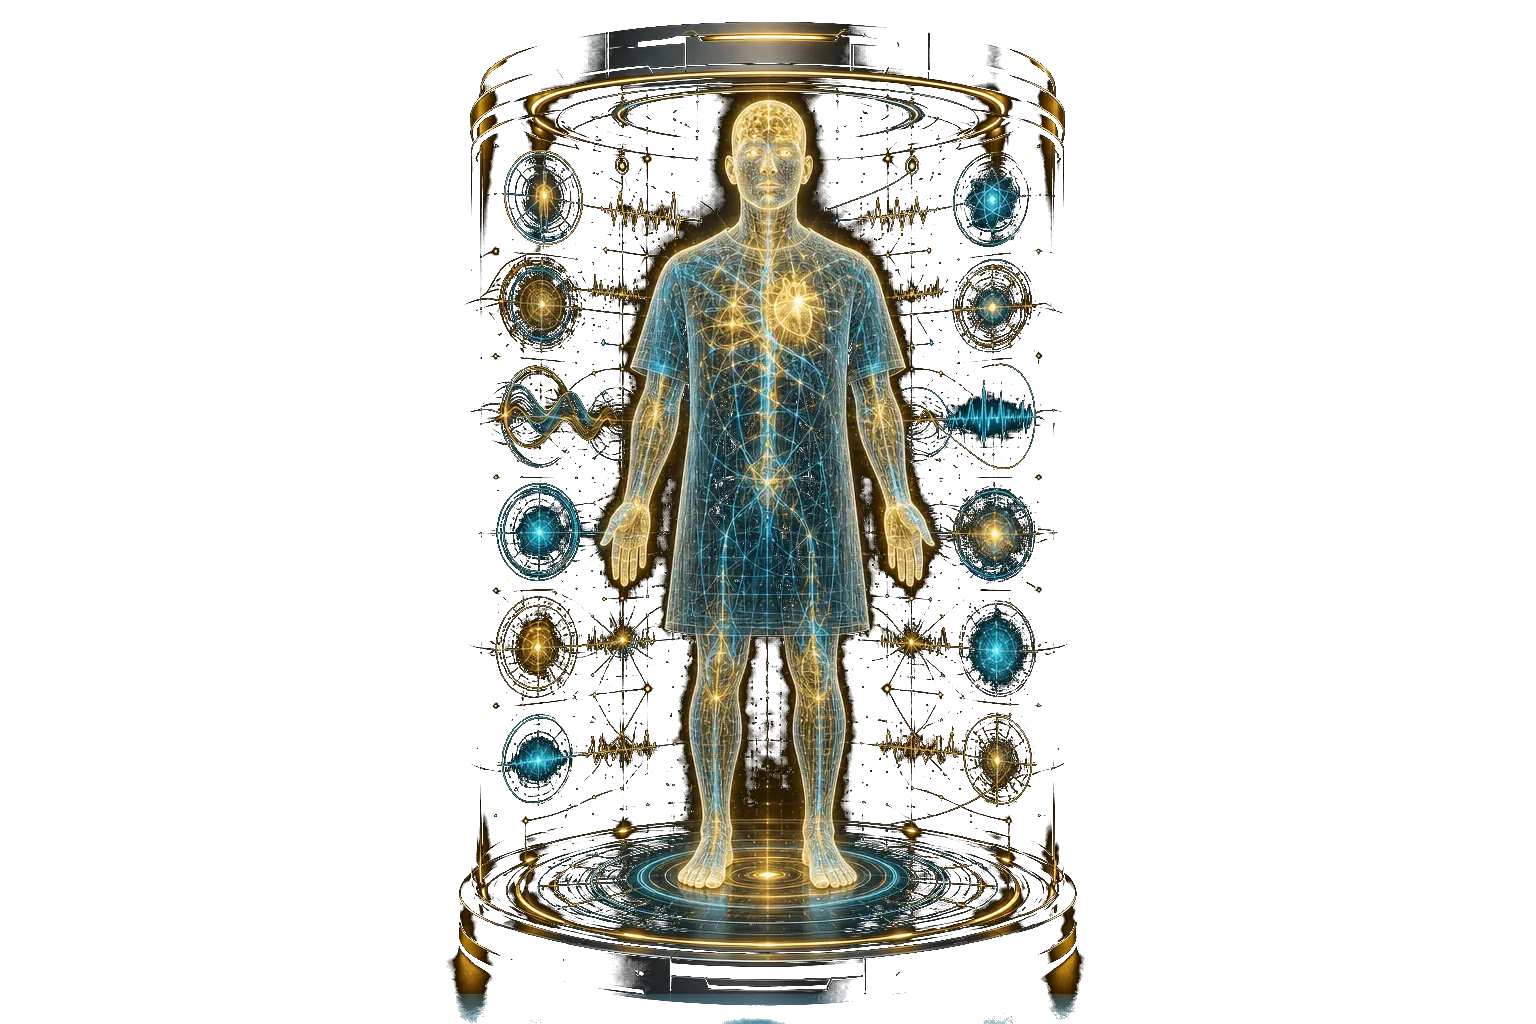
Next-gen health analysis and guided wellness support via light-trigger sensors and scalar waves, delivered remotely from your home.
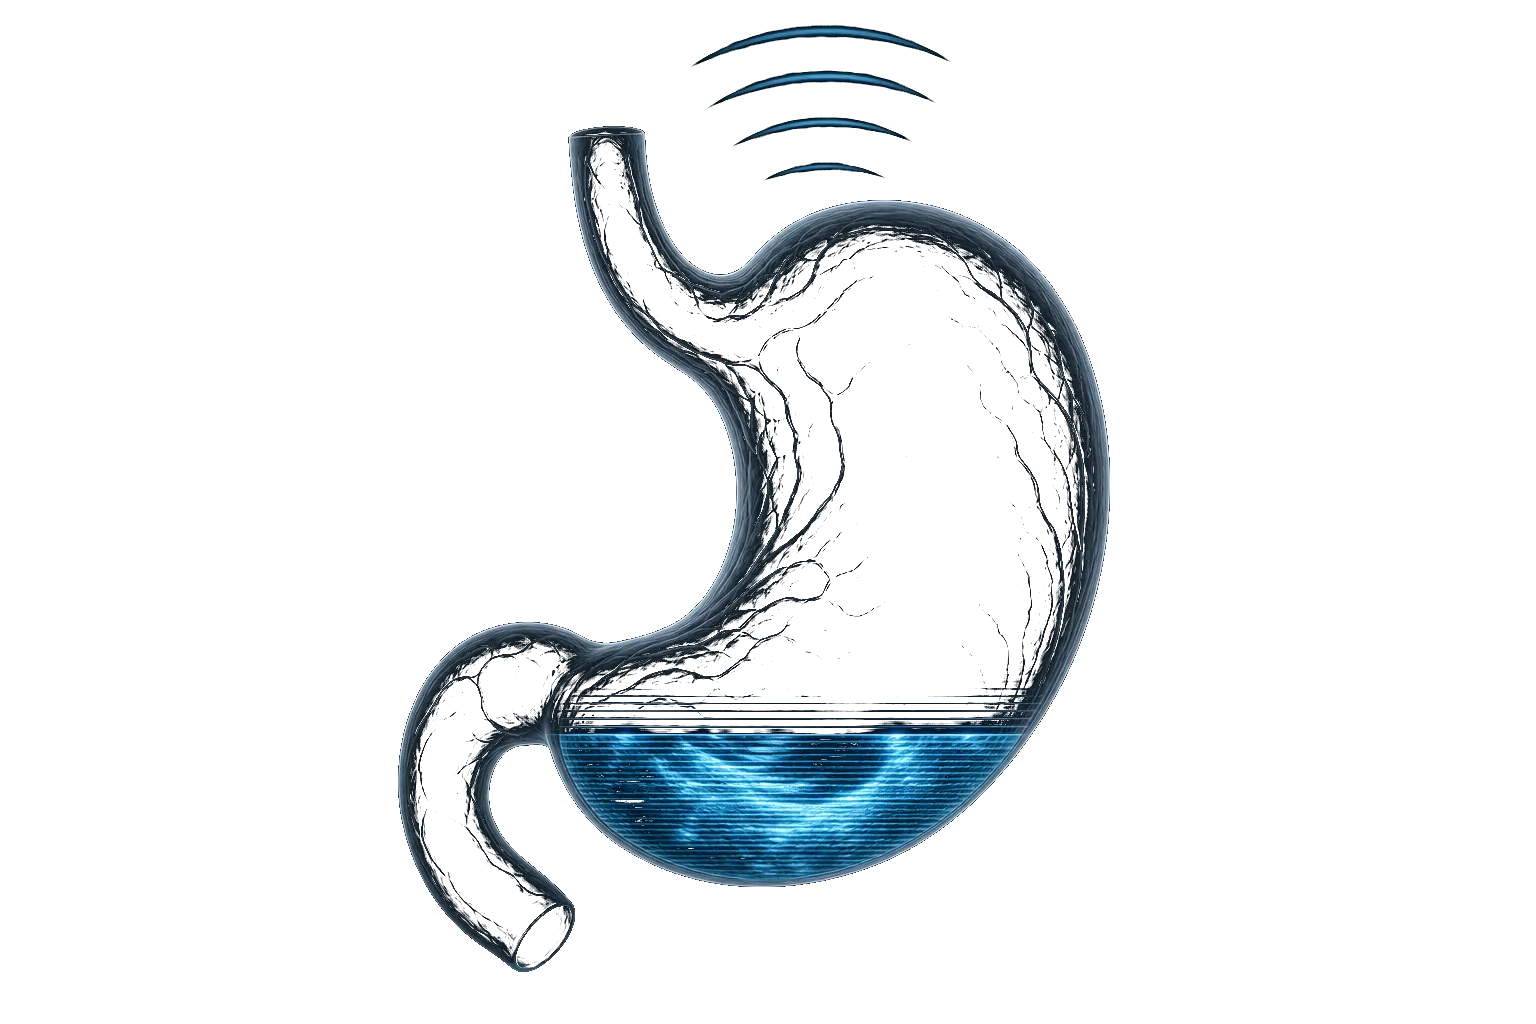
Holographic
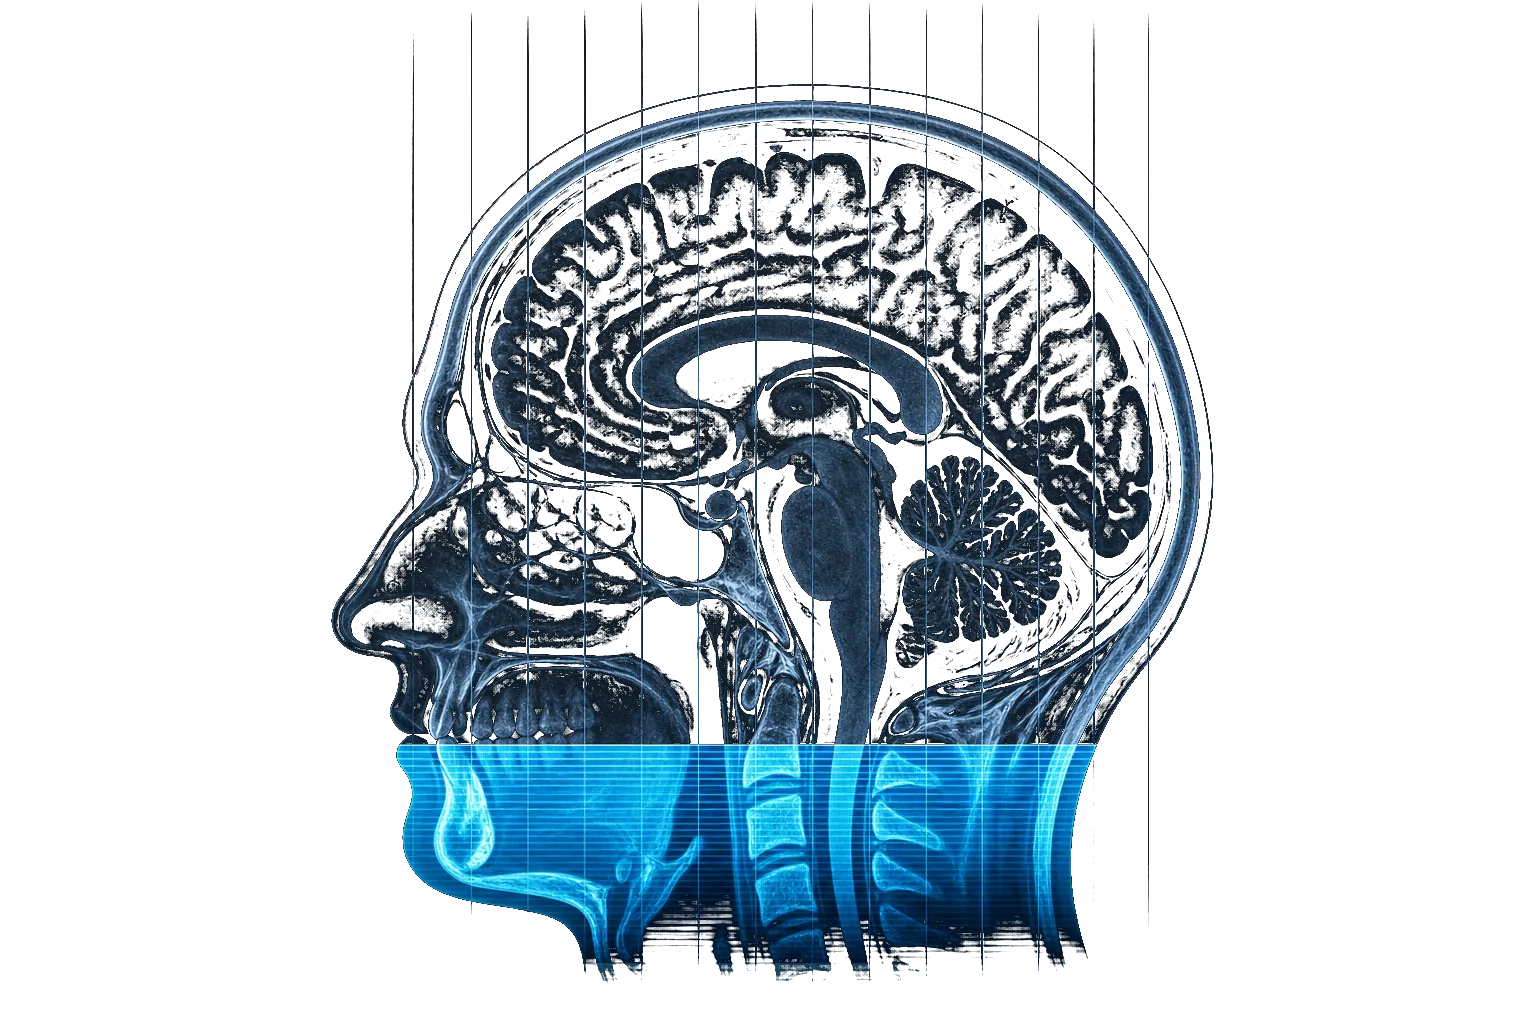
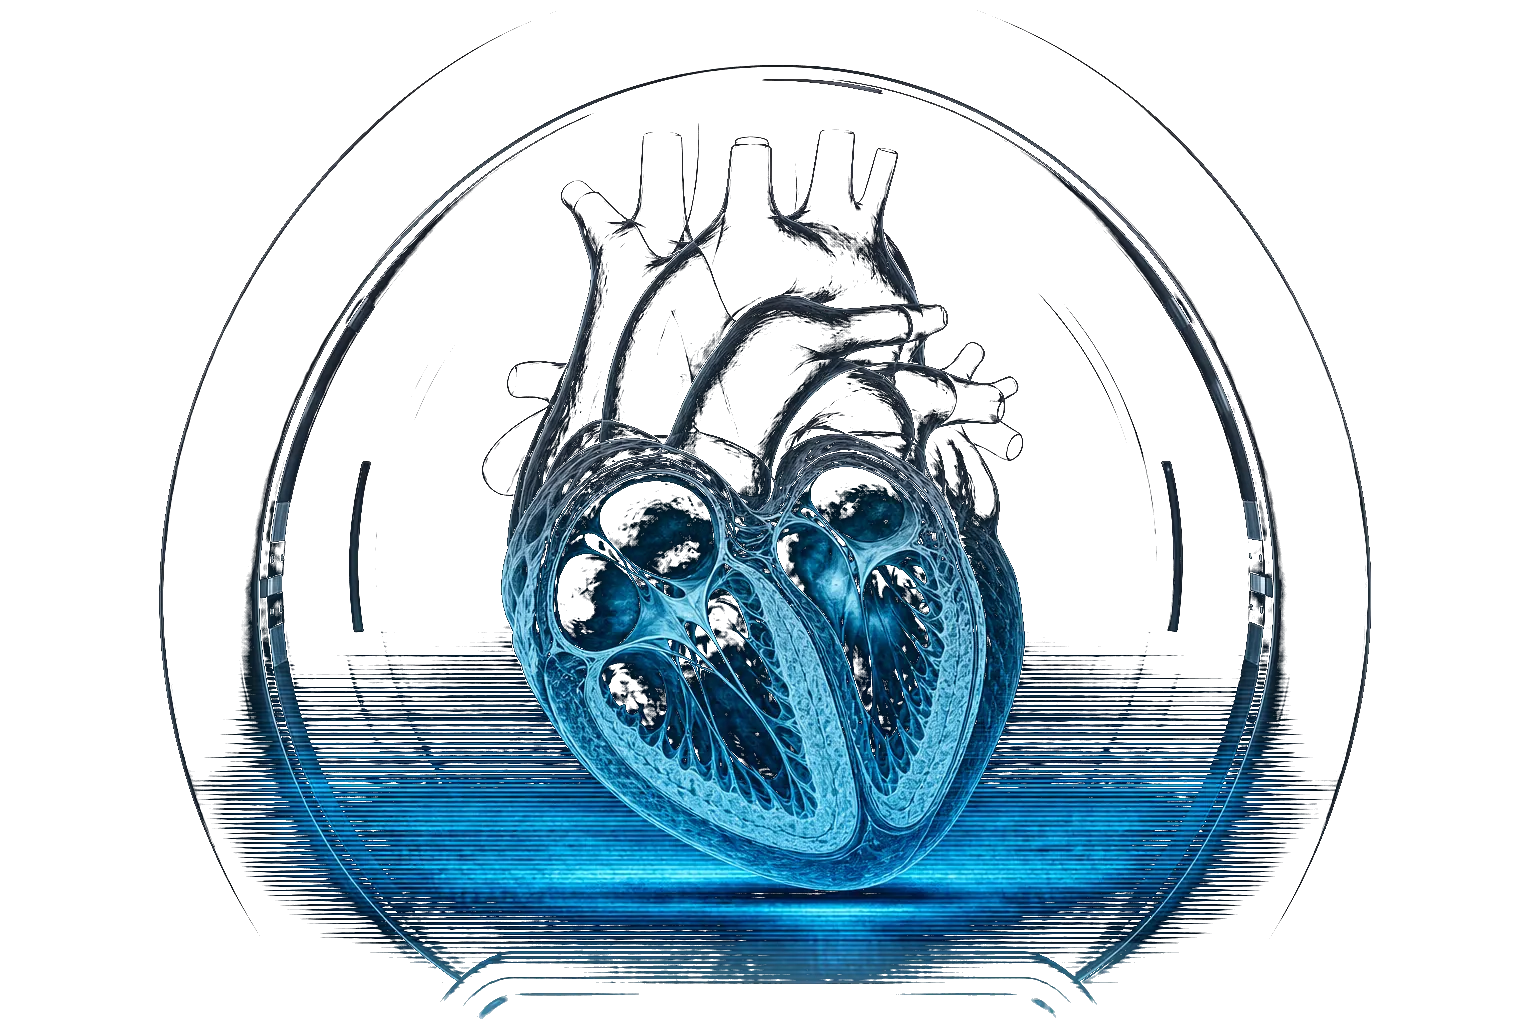
Sensors detect cellular electromagnetic frequencies
Nonlinear Analysis
AI-powered algorithms map bio-field patterns against extensive signal databases
Actionable Intelligence
Real-time dashboards deliver predictive insights for holistic decision support
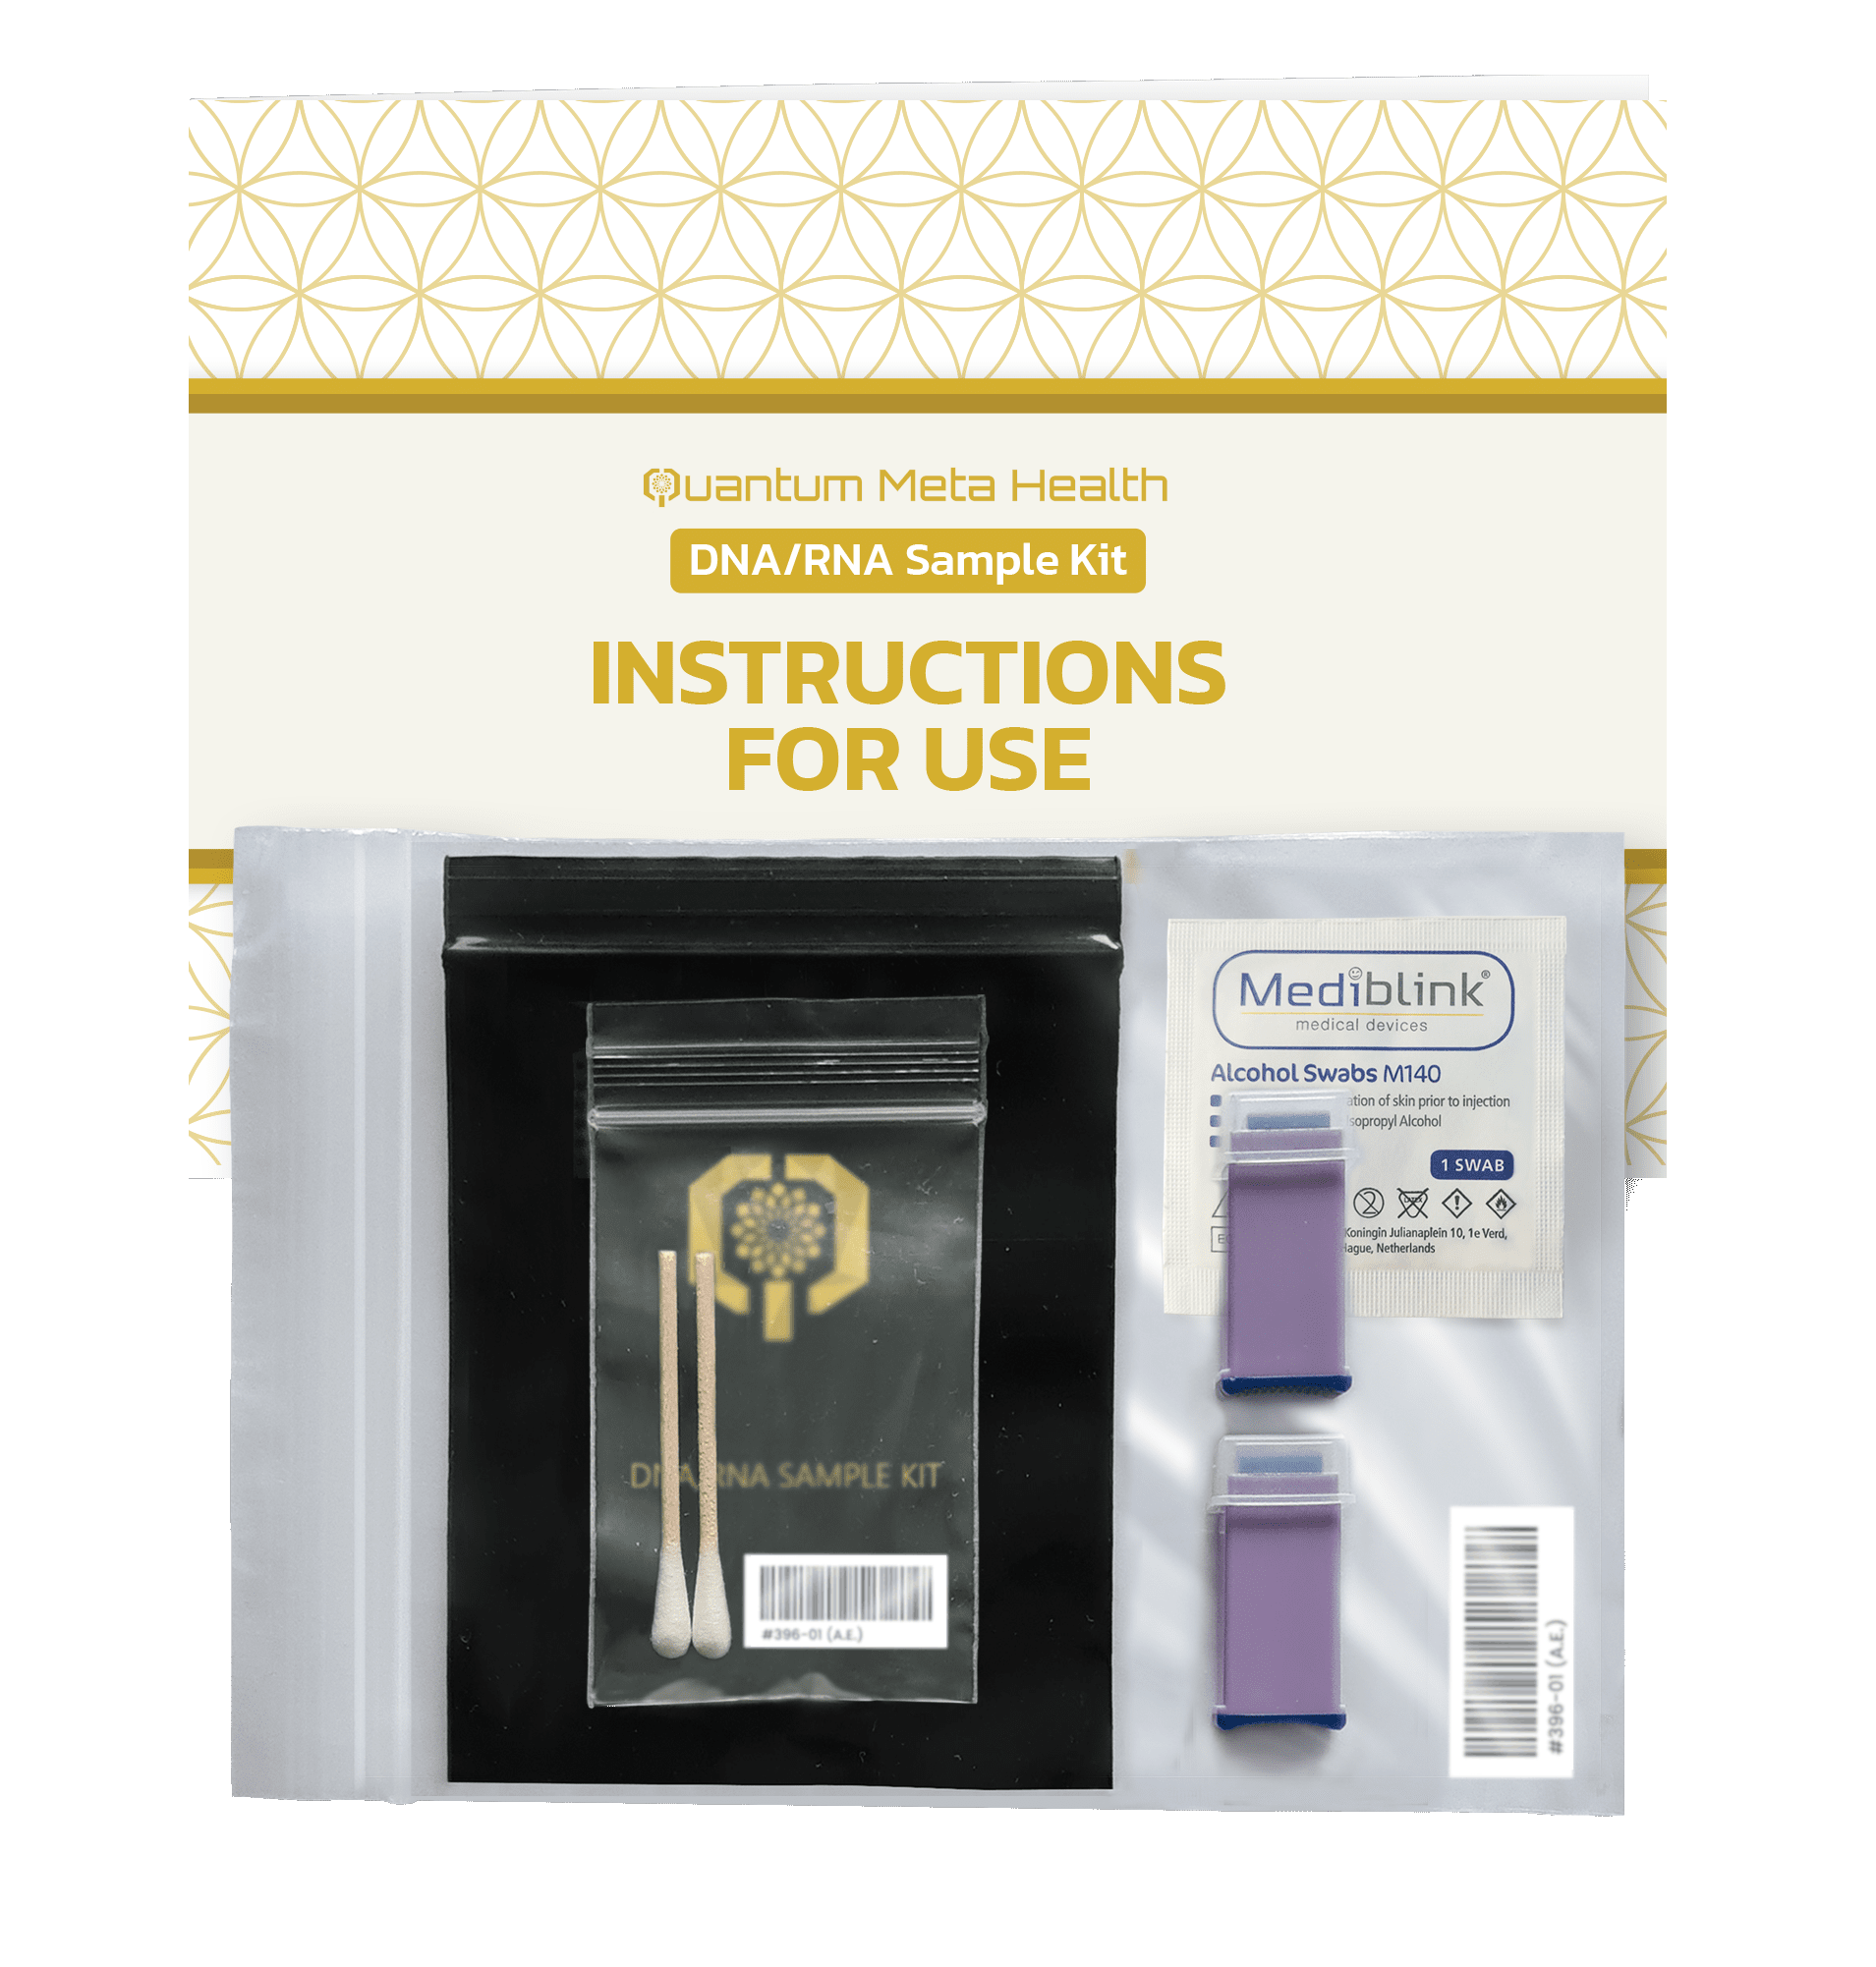
Kit Preview
Zero-Point · Torsion Technology
DNA/RNA Sample Kit: at-home sample collection for bio-signal mapping
Full-Body Scan · Coefficient Overview
Your Signal Landscape at a Glance
Priority bands, distribution ring, and protocol focus. Open your dashboard →
Signal Timeline · Trend Analysis
Track Signals Through Time
Monitor how your body signal patterns evolve across time — not just a single snapshot. Explore Timeline Reports →
Comparative Accuracy
NLS vs Other Inspection Methods
High-accuracy · Early-stage pathology recognition
Ultrasonography
Tomography
MRI
NLS
Based on research results across Gastroenterology, Pulmonology, Gynecology, and Endocrinology.
Comfort-focused · Intelligence · experience
Absolutely Safe and User Friendly
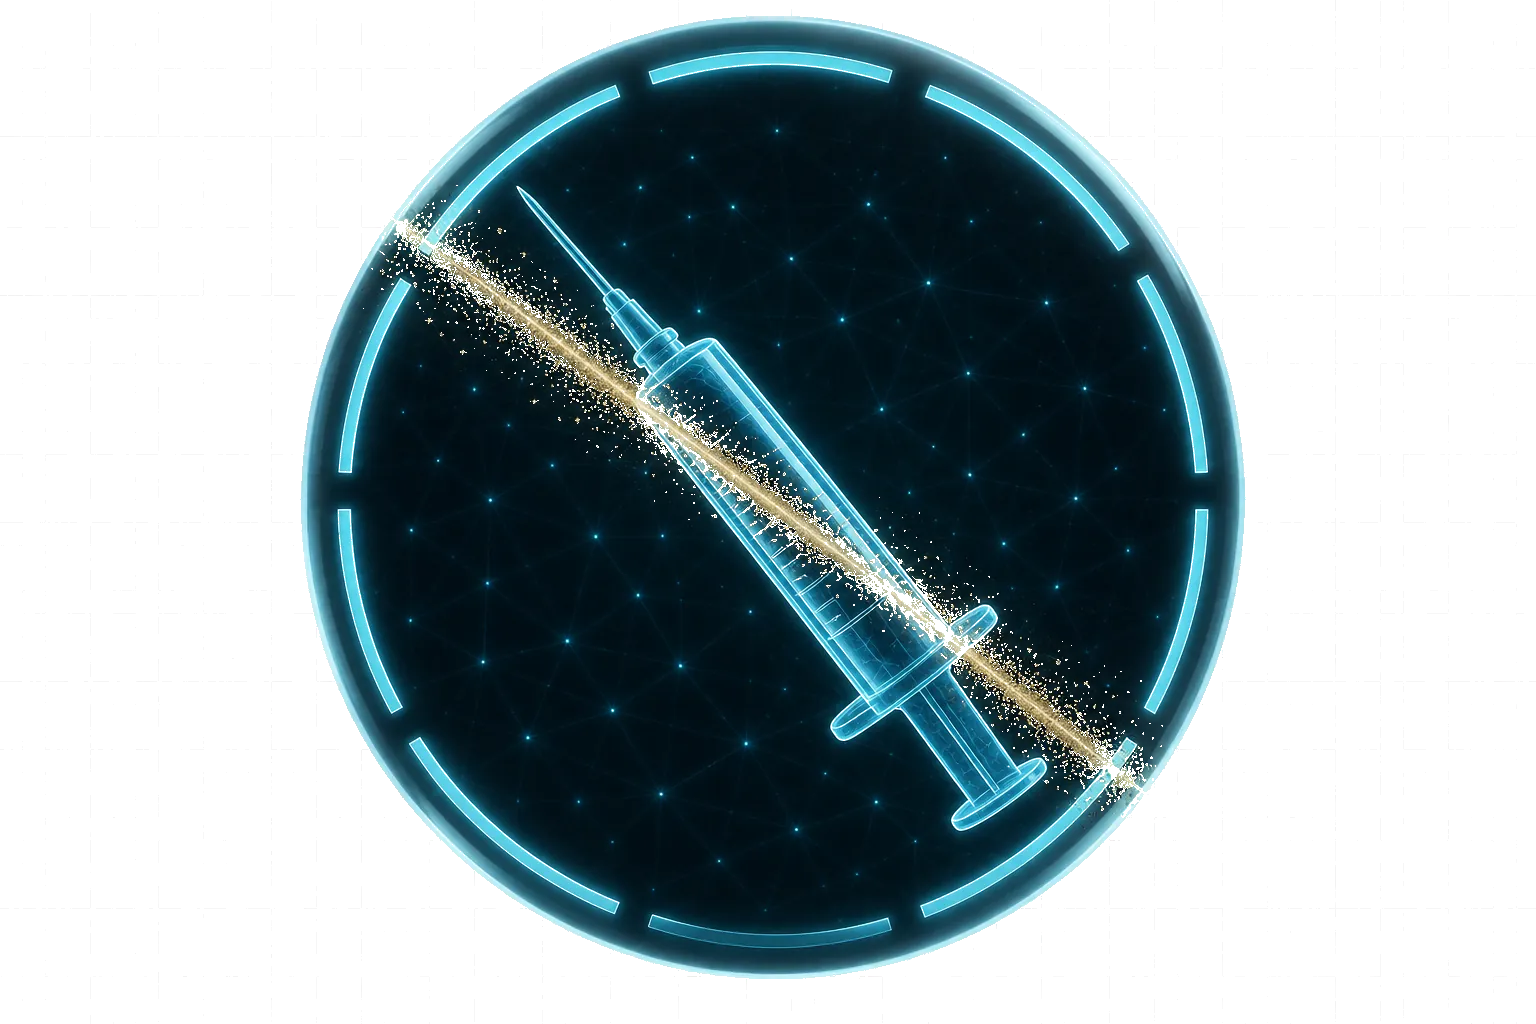
Non Invasive*
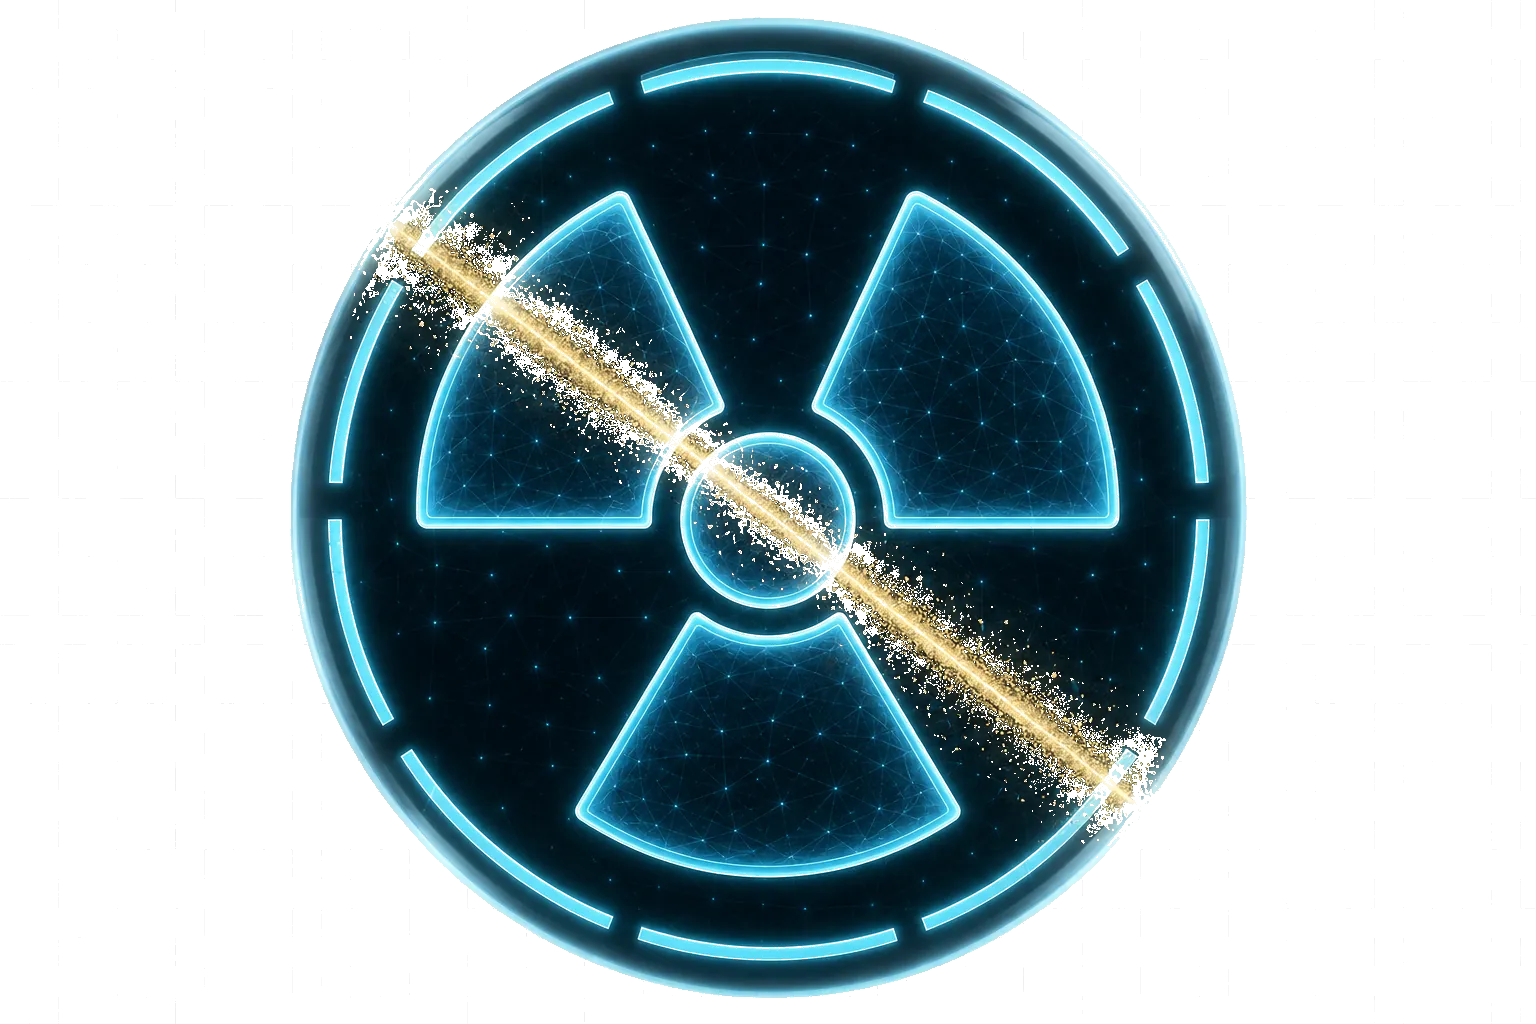
Free of Radiation

No Internal Probing
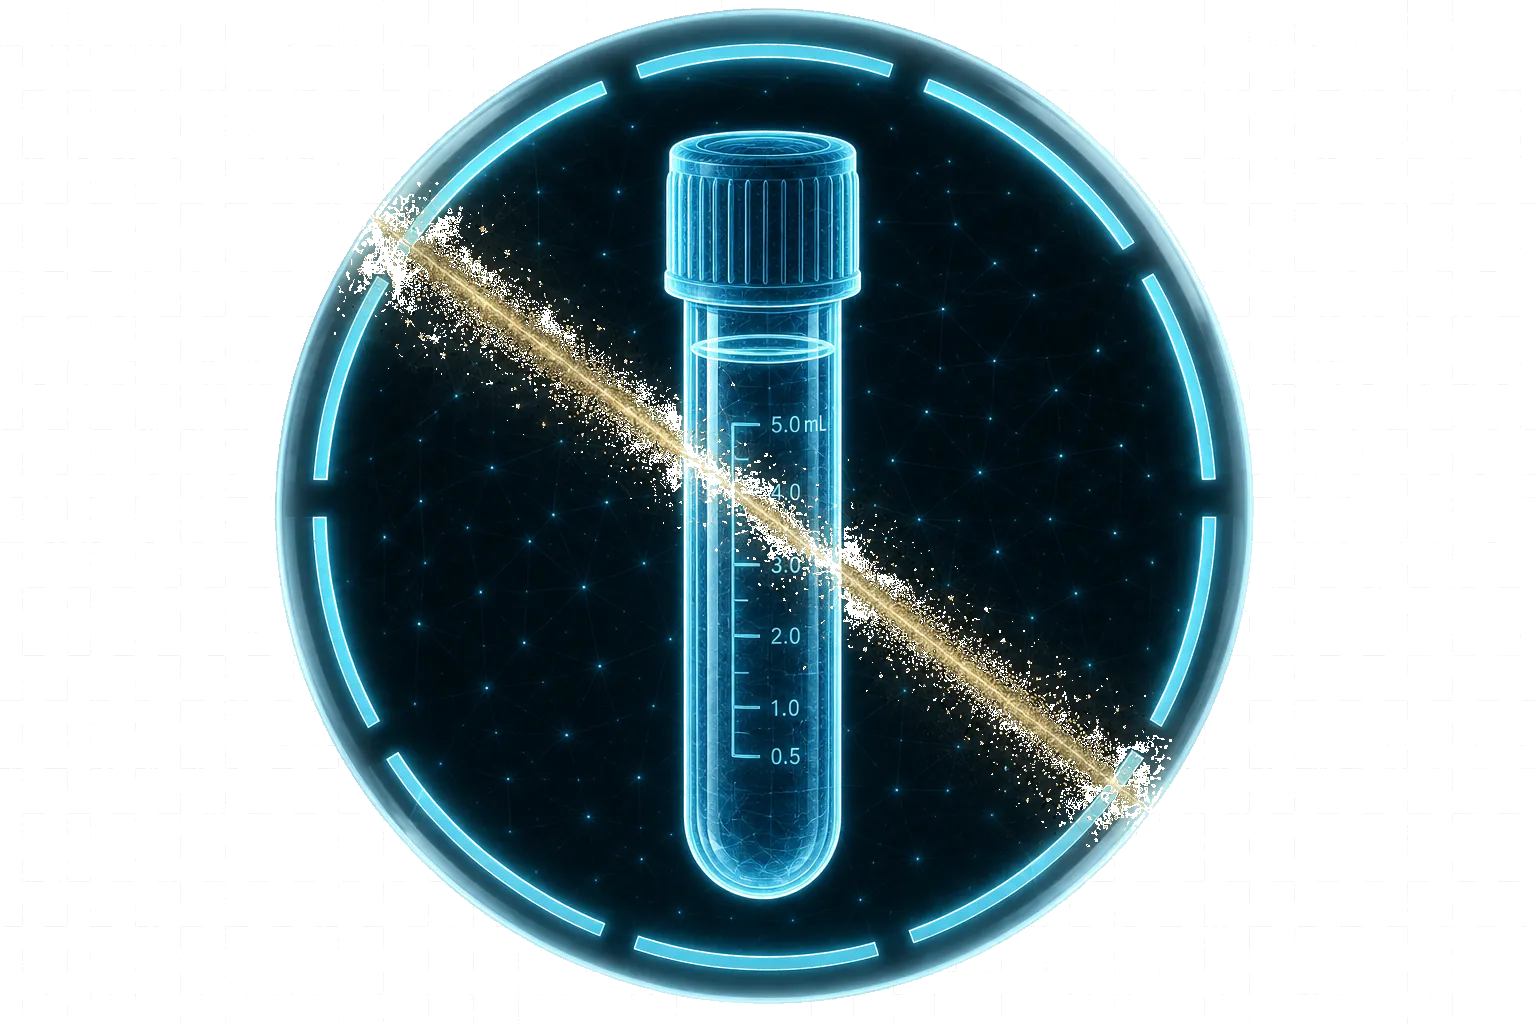
No Large Blood Draws
*Dry DNA/RNA samples, such as hair, saliva, nails, and blood drops, can be utilized alongside NLS scanning to improve accuracy and offer deeper health insights.
Integrated scan modules
Complete Multi-System Assessment in One Integrated Scan
Diagnostics, report layers, and corrective workflows — organized within one remote session.
Research Scan
A foundational energetic review designed to identify priority stress patterns, resonance imbalances, and key areas requiring deeper analysis.
NLS Body Analysis Report
A structured overview of systemic bioinformational findings, highlighting functional shifts, organ stress indicators, and broader wellness patterns.
→ Learn moreAllergens
Screens for sensitivity signatures that may contribute to inflammation, reactivity, energetic burden, or reduced physiological resilience. Provides additional perspective on environmental triggers, food interactions, and subtle load factors affecting overall stability.
→ Learn morePathologies
Reviews imbalance patterns associated with chronic dysfunction and stress markers to support a more precise wellness interpretation. Expands insight into pattern evolution, recurrence tendencies, and deeper systemic relationships influencing long-term balance.
→ Learn moreMicroorganisms & Helminths
Evaluates microbial and parasitic stress signatures that may influence vitality, immune balance, digestion, and long-term energetic stability. Extends into identifying persistent interference patterns and their potential impact on systemic coherence and recovery capacity.
→ Learn moreFood
Assesses how specific foods may interact with your current energetic state, helping reveal supportive choices and potential stress contributors.
→ Learn moreClient experiences
Opting for bioresonance therapy has truly been a life changing decision for me. It not only elevated my energy levels but also uncovered gluten sensitivity as the hidden cause of my health struggles.
I was sceptical at first due to a highly innovative approach to healing but after I entrusted my health issues into dedicated professional hands, I started noticing a quantitative difference in my overall wellbeing.
The blend of advanced quantum science and holistic health principles has greatly improved my well-being. Since starting their treatments and supplements, my energy levels have increased, and stress-related issues have eased.
My appointment was not only enjoyable but also deeply healing. The level of care and attention provided was exceptional, and I look forward with genuine anticipation to my next session for Quantum Flow.
I recently tried Quantum Meta Health treatments and supplements, and I am absolutely thrilled with the results! The experience surpassed my expectations.
Quantum Meta Health gave me a whole new perspective on wellness. The session was insightful and easy to follow, and I left feeling lighter and more balanced.
“We make advanced wellness solutions accessible to everyone. By leveraging quantum principles and cutting-edge technology, we are transforming well-being and empowering individuals with innovative health and longevity options that were once unattainable.”

Your path forward